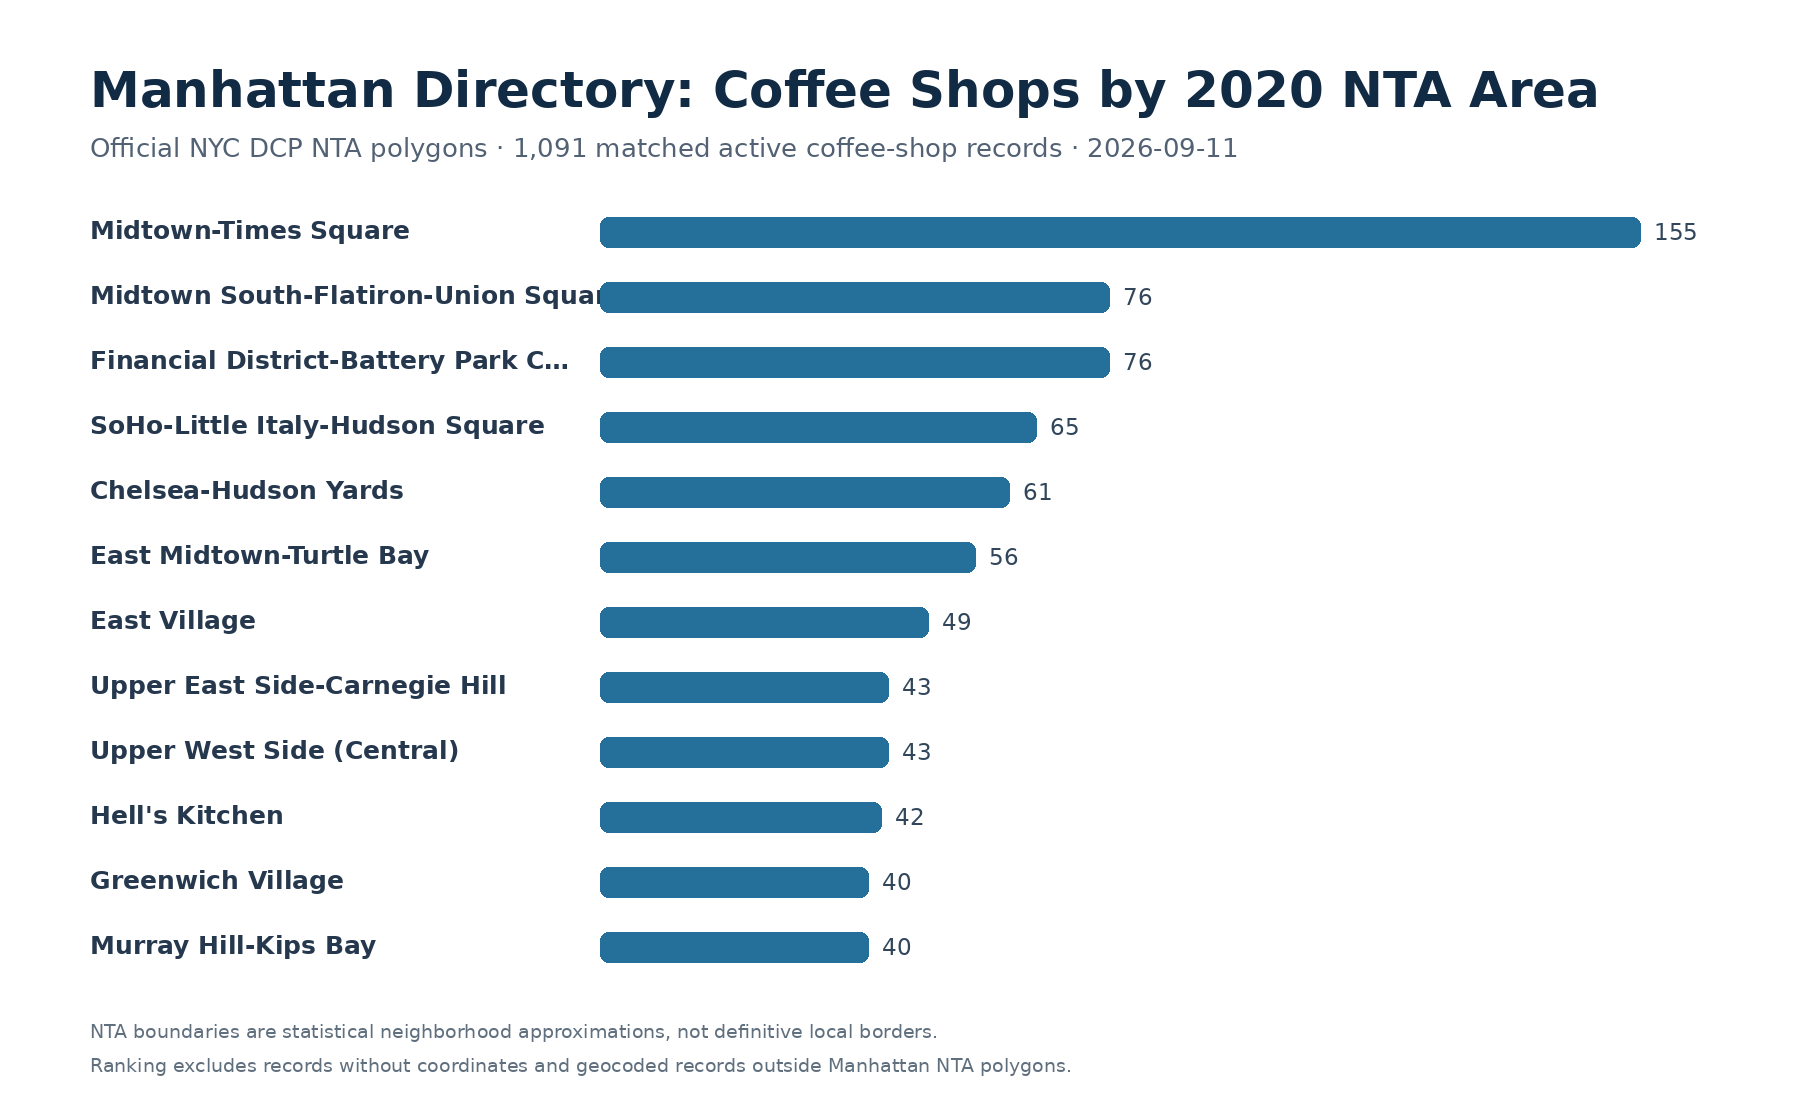
Manhattan Neighborhood Areas With the Most Coffee Shops 2026
Midtown-Times Square contains the largest number of matched Coffee shop records in Manhattan NYC's September 11, 2026 snapshot. The ranking assigns geocoded listings to official NYC 2020 Neighborhood Tabulation Area polygons and excludes records that cannot be reliably placed inside Manhattan geometry.
Image: Manhattan NYC — generated from the September 11, 2026 directory snapshot and NYC DCP 2020 NTA geometry
What this ranking measures
This report counts active Manhattan NYC directory records whose raw stored category is exactly Coffee shop and assigns each geocoded record to a 2020 Neighborhood Tabulation Area, or NTA, published by the New York City Department of City Planning. The result is a reproducible neighborhood-area ranking built from coordinates rather than the directory's older broad district labels.
The distinction matters. The raw district field groups coffee shops into only a handful of broad labels such as Midtown Manhattan, Downtown Manhattan, Uptown Manhattan and Upper East Side Manhattan. Those values are too coarse for a credible neighborhood ranking and also contain some clearly unreliable assignments. Rather than force those labels into a story, this analysis uses each listing's latitude and longitude against an official polygon layer.
Coverage before ranking
The September 11, 2026 directory snapshot contains 1,149 active records whose raw category equals Coffee shop. Of those, 1,128 have stored coordinates, which is 98.17% coordinate coverage for this category. The point-in-polygon process assigns 1,091 of those geocoded records to exactly one Manhattan 2020 NTA. That is a 96.72% match rate among geocoded coffee-shop records and 94.95% of all active Coffee shop records in the snapshot.
Twenty-one coffee-shop records lack coordinates and are excluded. Another 37 have coordinates that do not fall inside any Manhattan NTA polygon. Manual review of that unmatched group confirms why a hard geometry gate is useful: several records have addresses in Brooklyn, Queens, the Bronx or New Jersey while carrying a Manhattan-style district label, and a few records contain clearly erroneous coordinates far outside New York. No record matched more than one NTA polygon.
Midtown-Times Square ranks first
Midtown-Times Square ranks first with 155 matched coffee-shop records, representing 14.2% of all coffee-shop records successfully assigned to Manhattan NTAs. That lead is substantial: the next two NTA areas each contain 76 matched records. Midtown's concentration is plausible for a directory covering a dense mix of offices, hotels, retail, transit hubs and visitor activity, but this table does not attempt to explain business formation or customer demand. It only reports the distribution of qualifying directory records.
Midtown South and the Financial District tie for second
Midtown South-Flatiron-Union Square and Financial District-Battery Park City each contain 76 matched Coffee shop records, or 7.0% of the matched population apiece. Their equal listing counts do not imply identical coffee scenes. The NTA polygons cover different street networks, land uses and daytime populations. The ranking is about directory record concentration inside a consistent geography, not about ambience, cafe quality or independent-shop share.
SoHo, Chelsea and East Midtown form the next tier
SoHo-Little Italy-Hudson Square ranks fourth with 65 matched records. Chelsea-Hudson Yards follows with 61, and East Midtown-Turtle Bay has 56. The East Village ranks seventh with 49. These counts illustrate why raw neighborhood names can be misleading in data work: some official NTA names combine places that residents and visitors commonly think of as distinct neighborhoods. The source layer is designed for statistical reporting rather than perfect cultural labeling.
Upper Manhattan and park-side areas are split into several NTAs
The Upper East Side and Upper West Side do not appear as one single row each. The 2020 NTA geography divides them into more specific areas. Upper East Side-Carnegie Hill and Upper West Side (Central) each contain 43 matched coffee-shop records. Upper East Side-Lenox Hill-Roosevelt Island contains 33, Upper East Side-Yorkville 31 and Upper West Side-Lincoln Square 20. This subdivision is one reason NTA-based counts should not be casually compared with marketing pages that use broader neighborhood definitions.
Hell's Kitchen, Greenwich Village and Murray Hill-Kips Bay remain substantial
Hell's Kitchen has 42 matched coffee-shop records. Greenwich Village and Murray Hill-Kips Bay each contain 40, while West Village contains 39 and Tribeca-Civic Center 37. These rows show that the directory's coffee coverage is not limited to the highest-density Midtown core. Multiple downtown and residential-oriented NTA areas have meaningful listing pools suitable for more focused editorial review.
Stored reviews are shown, but they do not determine rank
The ranking table includes total stored review counts as a descriptive secondary column. Midtown-Times Square's 155 matched coffee-shop records collectively carry 65,880 stored reviews in the snapshot. Midtown South-Flatiron-Union Square has 34,490, while Financial District-Battery Park City has 28,659. Those numbers can help identify where the dataset has deeper public-feedback history, but they are not used to order the neighborhood areas.
That choice is deliberate. A neighborhood area with fewer but extremely reviewed cafes can accumulate more reviews than an area with more coffee-shop listings. Review volume also depends on listing age, platform behavior, chains, visitor traffic and other factors unrelated to how many coffee shops physically exist.
Why this is not a census of Manhattan coffee shops
The directory may contain duplicate or near-duplicate source records, multiple branches of the same chain, category inconsistencies and records that have moved or closed since source collection. The analysis also includes only businesses stored under the exact raw category Coffee shop. A bakery, cafe, restaurant, hotel lobby or bookstore that serves coffee but carries another category is not counted. For those reasons, the headline should be read as “matched Coffee shop records in the Manhattan NYC directory,” not as an official count of every cafe in each neighborhood.
Why NTAs are useful despite their limits
NYC Department of City Planning describes Neighborhood Tabulation Areas as approximations of neighborhoods created for reporting Census and American Community Survey data. They aggregate census tracts and are designed for statistical reliability. That makes them far more defensible for reproducible aggregation than an undocumented text label, but it does not make them definitive neighborhood borders.
A business near a cultural neighborhood edge can fall into an NTA whose official name differs from the way the business markets its location. This report therefore uses the phrase neighborhood areas and prints the official NTA names rather than silently rewriting them into colloquial labels.
What changed from the earlier data-quality concern
An earlier version of this data-story idea was intentionally not published because the directory's district field was too broad and noisy. The replacement method does not overwrite that field. Instead, it creates an analytical normalization layer from coordinates plus an immutable copy of the official Manhattan NTA geometry. The exact GeoJSON file is hashed in the snapshot so a future run can prove which geometry version produced the ranking.
This also creates a useful audit trail. The 37 geocoded records that fall outside Manhattan NTA geometry are written to a separate internal audit file rather than being silently discarded. Those records can be reviewed later for coordinate correction, borough contamination or source-quality cleanup without changing the published 2026 snapshot.
How to use this report
The ranking is useful for deciding where the directory has enough coffee-shop depth to support future editorial collections, where coordinate cleanup may improve coverage and how strongly coffee listings cluster across official statistical neighborhood areas. It should not be used to declare the “best coffee neighborhood,” estimate cafe revenue, calculate establishments per resident or compare business density without an appropriate land-area or population denominator.
The September 11, 2026 snapshot is immutable for this publication. Future editions should download or archive the relevant official geometry, rebuild the point assignments from then-current active records and publish a new dated snapshot rather than silently changing the historical table.
2026 directory snapshot
Top official 2020 NTA neighborhood areas by matched Coffee shop records
| Rank | 2020 NTA neighborhood area | Matched coffee shops | Share of matched (%) | Stored reviews |
|---|---|---|---|---|
| 1 | Midtown-Times Square | 155 | 14.2 | 65880 |
| 2 | Midtown South-Flatiron-Union Square | 76 | 7.0 | 34490 |
| 3 | Financial District-Battery Park City | 76 | 7.0 | 28659 |
| 4 | SoHo-Little Italy-Hudson Square | 65 | 6.0 | 27800 |
| 5 | Chelsea-Hudson Yards | 61 | 5.6 | 28184 |
| 6 | East Midtown-Turtle Bay | 56 | 5.1 | 15214 |
| 7 | East Village | 49 | 4.5 | 23963 |
| 8 | Upper East Side-Carnegie Hill | 43 | 3.9 | 18859 |
| 9 | Upper West Side (Central) | 43 | 3.9 | 14412 |
| 10 | Hell's Kitchen | 42 | 3.8 | 22550 |
| 11 | Greenwich Village | 40 | 3.7 | 15343 |
| 12 | Murray Hill-Kips Bay | 40 | 3.7 | 12576 |
| 13 | West Village | 39 | 3.6 | 27100 |
| 14 | Tribeca-Civic Center | 37 | 3.4 | 16680 |
| 15 | Upper East Side-Lenox Hill-Roosevelt Island | 33 | 3.0 | 9553 |
| 16 | Upper East Side-Yorkville | 31 | 2.8 | 9332 |
| 17 | Upper West Side-Lincoln Square | 20 | 1.8 | 7959 |
| 18 | Morningside Heights | 18 | 1.6 | 3052 |
| 19 | Lower East Side | 17 | 1.6 | 5004 |
| 20 | Upper West Side-Manhattan Valley | 17 | 1.6 | 3789 |
Field coverage
| Field | Records | Coverage |
|---|---|---|
| Phone number | 209162 | 88.8% |
| Rating | 179476 | 76.2% |
| Reviews | 212599 | 90.2% |
| Website | 169850 | 72.1% |
| Coordinates | 227814 | 96.7% |
| Working hours | 135674 | 57.6% |
| Gallery images | 196089 | 83.2% |
| Reservation link | 117972 | 50.1% |
Methodology
The analysis starts with all production Business records where is_active=True and the raw stored category equals Coffee shop exactly. Records without latitude or longitude are excluded before spatial assignment. Each geocoded point is tested against a locally archived GeoJSON containing the 38 Manhattan features from NYC Department of City Planning's 2020 Neighborhood Tabulation Areas dataset. Standard point-in-polygon logic respects polygon holes and MultiPolygon geometry. A record is counted only when it falls inside exactly one Manhattan NTA. The build fails if multiple polygon matches occur or if fewer than 95% of geocoded coffee-shop records match Manhattan NTA geometry. The September 11 run matched 1,091 of 1,128 geocoded records, or 96.72%, with zero multiple matches. The 37 unmatched geocoded records and 21 records missing coordinates are preserved in a separate internal audit file. Ranking is by matched record count only; stored review totals are secondary descriptive fields. The official NTA GeoJSON SHA-256 is stored in the immutable snapshot for reproducibility.