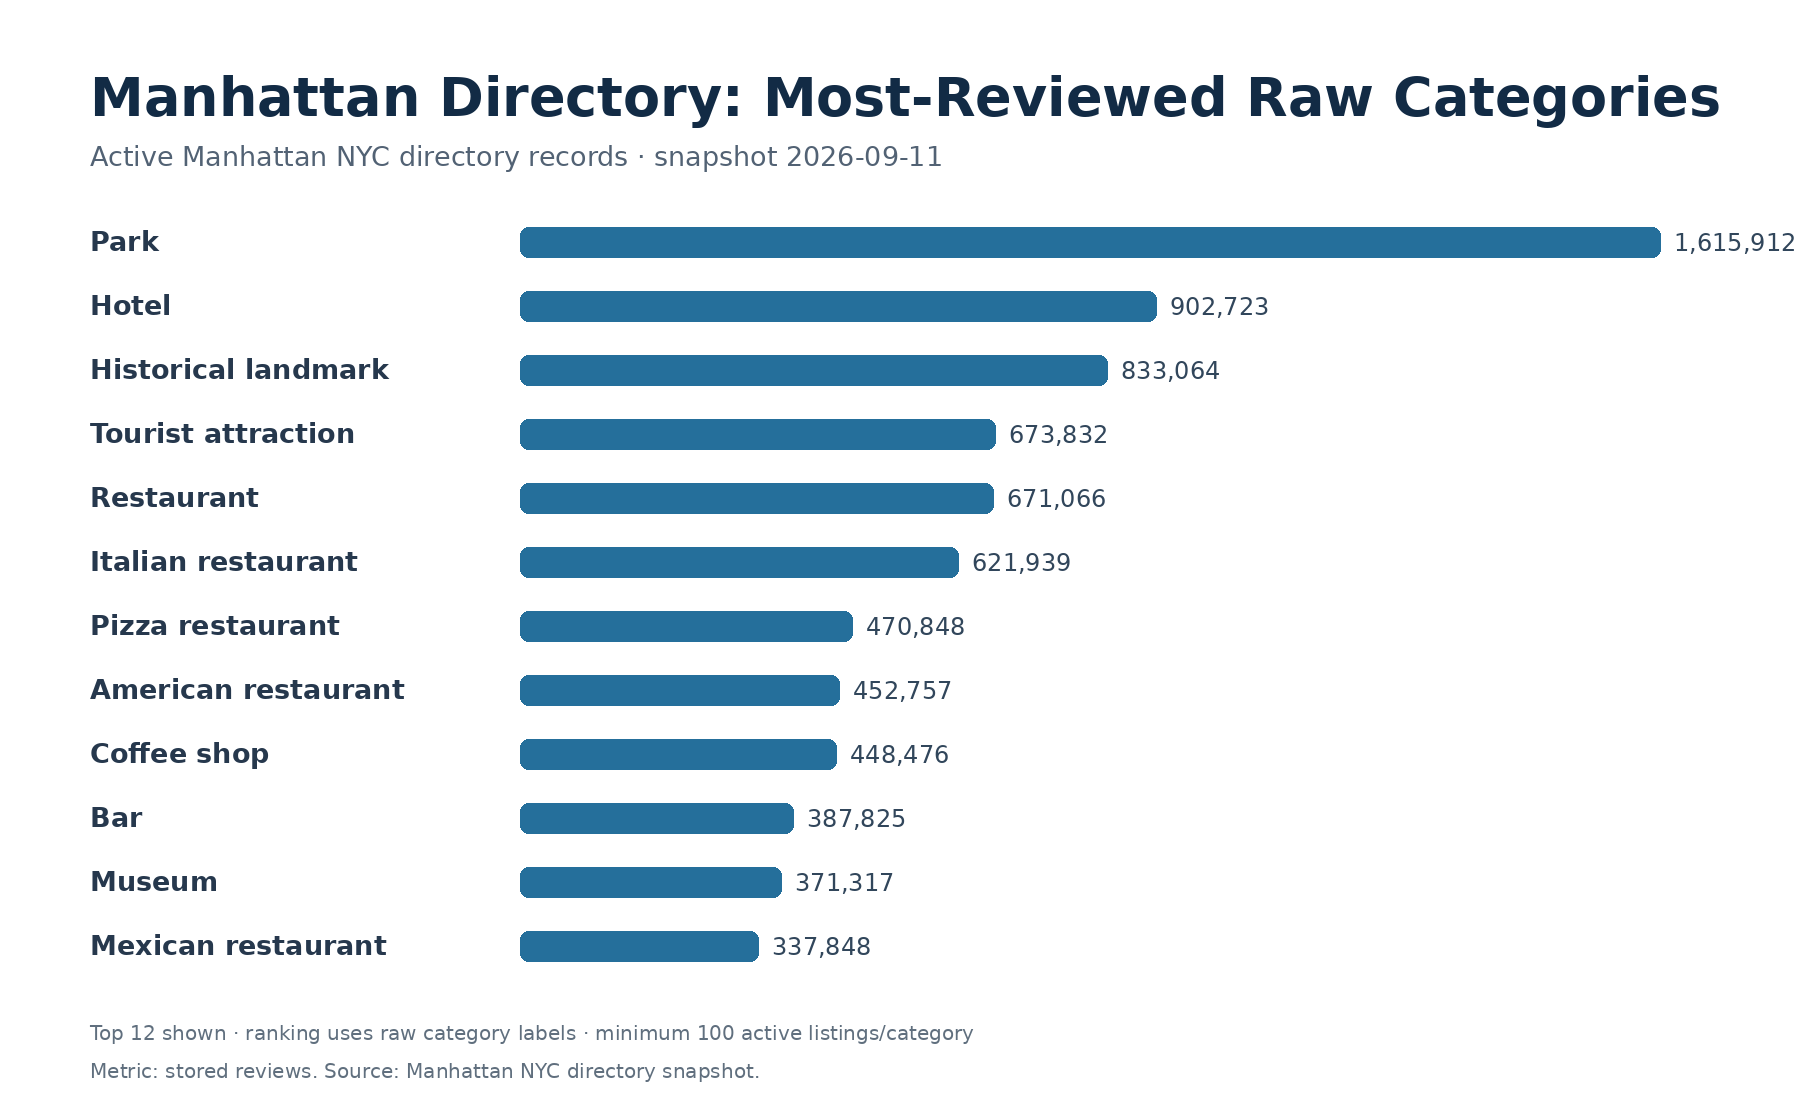
Manhattan's Most-Reviewed Business Categories 2026
Parks, hotels, historical landmarks and tourist attractions accumulate the largest stored review totals among Manhattan NYC raw categories with at least 100 active listings. The ranking measures directory review volume, not quality, popularity per person or a census of unique establishments.
Image: Manhattan NYC — generated from the September 11, 2026 directory snapshot
What this ranking measures
This report ranks raw category labels in the Manhattan NYC directory by the sum of each active listing's stored review_count value. To reduce the distortion created by tiny categories with one or two extremely reviewed places, a raw category must contain at least 100 active listings to enter the table. The result is a picture of review volume inside this directory snapshot, not a ranking of quality and not an estimate of how many people physically visited each type of place.
The snapshot contains 235,578 active directory records. Of those, 212,599 have a stored review count greater than zero, or 90.2% of active listings. Category labels are used exactly as stored. That point matters because the dataset is not a fully normalized taxonomy: “Restaurant,” “Italian restaurant,” “Pizza restaurant” and “American restaurant” are separate raw labels rather than one rolled-up restaurant super-category.
Parks lead the eligible raw categories by total stored reviews
The raw category Park ranks first with 1,615,912 stored reviews across 896 active listings. That works out to roughly 1,803.5 stored reviews per active park listing in the snapshot. The figure should not be interpreted as a citywide park attendance measure. It simply shows that places recorded under the Park label attract unusually deep review histories inside the source data.
Hotel ranks second with 902,723 stored reviews across 694 active listings. Historical landmark follows with 833,064 across 590 listings, and Tourist attraction reaches 673,832 across 312 listings. These categories combine comparatively modest listing counts with very large review totals, which is consistent with a directory containing many high-visibility visitor destinations. Again, this is a review-volume observation rather than a judgment that one category is better or more important than another.
Restaurants dominate much of the next tier
The broad raw label Restaurant ranks fifth with 671,066 stored reviews across 1,326 active listings. Several more specific food categories appear immediately around it. Italian restaurant has 621,939 stored reviews across 585 listings; Pizza restaurant has 470,848 across 551; and American restaurant has 452,757 across 347. Coffee shop ranks ninth with 448,476 reviews across 1,149 listings, while Bar ranks tenth with 387,825 across 782.
These rows are especially sensitive to taxonomy fragmentation. If all food and drink labels were normalized into larger families, the ordering would change substantially. We intentionally do not perform that roll-up here because it would introduce editorial classification decisions into what is meant to be a transparent snapshot of stored values.
Review density tells a different story from review totals
Total reviews reward categories that either contain many listings, attract heavy reviewing, or both. Looking at reviews per listing helps reveal the difference. Tourist attractions average about 2,159.7 stored reviews per eligible listing in this snapshot. Museums, which rank eleventh by total review volume, average about 2,475.4 reviews per listing across 150 active records. Shopping malls and department stores also show high review-per-listing figures despite much smaller listing counts.
That does not mean those categories are more loved. A single listing can represent a large public institution, complex or attraction that naturally collects far more reviews than a small professional office. Review density therefore reflects the type of place and the way people use review platforms as much as it reflects consumer attention.
Why professional-service categories do not dominate this table
The Manhattan directory contains many medical, legal, consulting and professional-service listings, but most do not generate review histories on the same scale as parks, hotels, major attractions or restaurants. For example, Dentist is one of the directory's largest raw categories by listing count, yet its total review volume remains well below the leading visitor and hospitality categories. This illustrates why listing count and review count should be analyzed separately.
What this data can support
The ranking is useful for understanding where review depth is concentrated inside the directory, choosing categories that may support richer review-based analysis, and identifying sectors where Manhattan listings tend to have substantial public feedback. It can also help prioritize data-quality work: categories with large review totals deserve careful handling because ranking or recommendation systems can overreact to review volume if they do not account for category size and venue type.
What this data cannot support
This table cannot tell us which category has the happiest customers, which category has the highest revenue, which places receive the most annual visitors, or which sector is growing fastest. The directory can contain duplicate or near-duplicate source records. Review counts can change after the snapshot date. Raw categories may overlap conceptually. A hotel restaurant, museum cafe or park attraction may be categorized under one label even though a reader could reasonably place it in another family.
For those reasons, Manhattan NYC treats this as a dated dataset description. The immutable JSON snapshot used for the article preserves the exact ranking rows, source counts and limitations that supported publication on September 11, 2026. Future updates should create a new snapshot rather than silently rewriting the old measurement.
2026 directory snapshot
Top raw business categories by stored review volume
| Rank | Raw category | Active listings | Stored reviews | Reviews / listing |
|---|---|---|---|---|
| 1 | Park | 896 | 1615912 | 1803.5 |
| 2 | Hotel | 694 | 902723 | 1300.8 |
| 3 | Historical landmark | 590 | 833064 | 1412.0 |
| 4 | Tourist attraction | 312 | 673832 | 2159.7 |
| 5 | Restaurant | 1326 | 671066 | 506.1 |
| 6 | Italian restaurant | 585 | 621939 | 1063.1 |
| 7 | Pizza restaurant | 551 | 470848 | 854.5 |
| 8 | American restaurant | 347 | 452757 | 1304.8 |
| 9 | Coffee shop | 1149 | 448476 | 390.3 |
| 10 | Bar | 782 | 387825 | 495.9 |
| 11 | Museum | 150 | 371317 | 2475.4 |
| 12 | Mexican restaurant | 577 | 337848 | 585.5 |
| 13 | Bakery | 612 | 302430 | 494.2 |
| 14 | Shopping mall | 119 | 290319 | 2439.7 |
| 15 | Performing arts theater | 389 | 256584 | 659.6 |
| 16 | Department store | 121 | 252370 | 2085.7 |
| 17 | Hamburger restaurant | 171 | 244238 | 1428.3 |
| 18 | Chinese restaurant | 520 | 242178 | 465.7 |
| 19 | Indian restaurant | 275 | 237048 | 862.0 |
| 20 | Movie theater | 112 | 230200 | 2055.4 |
Field coverage
| Field | Records | Coverage |
|---|---|---|
| Phone number | 209162 | 88.8% |
| Rating | 179476 | 76.2% |
| Reviews | 212599 | 90.2% |
| Website | 169850 | 72.1% |
| Coordinates | 227813 | 96.7% |
| Working hours | 135674 | 57.6% |
| Gallery images | 196089 | 83.2% |
| Reservation link | 117970 | 50.1% |
Methodology
The snapshot was generated directly from Manhattan NYC's production directory on September 11, 2026. Only records with is_active=True were counted. Raw non-empty category values were grouped exactly as stored. For the review-volume ranking, each category's stored review_count values were summed and only categories with at least 100 active listings were eligible. Reviews per listing is total stored reviews divided by active listings in that raw category. No taxonomy normalization, deduplication, sentiment analysis or quality weighting was applied. Coverage metrics were recomputed in the same immutable snapshot so readers can distinguish field presence from real-world verification.